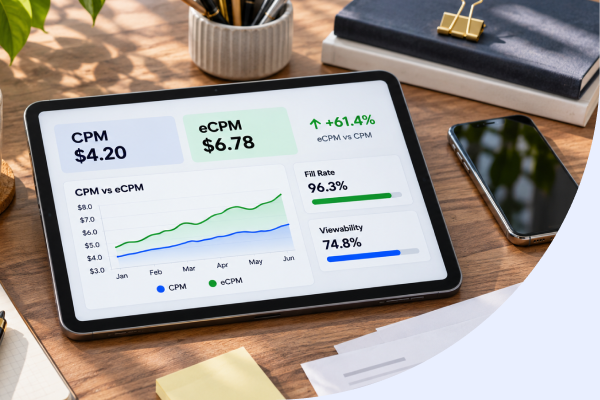
cpm vs ecpm
Your CPM can look healthy while publisher revenue falls short of expectations. The difference between CPM vs eCPM is whether a report shows an agreed price or the average yield across delivered impressions.
Key Takeaways
- CPM reflects the agreed price for ad impressions, while eCPM averages actual revenue across every impression delivered, including those sold at lower rates.
- A mismatch between reported CPM and real earnings usually signals that some impressions are filling below the headline rate or going unsold.
- Publishers should compare CPM and eCPM alongside fill rate and viewability to support better ad revenue optimization decisions.
- Diagnosing the gap between the two metrics before adjusting floor prices helps ensure the next test targets the real cause of the shortfall.
- Consistent measurement across a reporting period makes it easier to identify whether changes in revenue stem from pricing, demand or traffic mix.
Use the formulas and the reporting context together before treating a mismatch as an error. The same auction can produce different figures because advertisers and publishers are measuring different things.
CPM and eCPM: Two Numbers, One Auction, Two Different Questions
CPM is the cost per thousand impressions, using the advertiser’s campaign cost and measured impressions: CPM = (total campaign cost ÷ total measured impressions) × 1,000.
eCPM, or effective CPM, expresses revenue per thousand impressions: eCPM = (total revenue ÷ total impressions) × 1,000. “Mille” means one thousand; the shared unit makes the metrics comparable, but CPM describes a buyer’s price while eCPM describes a publisher’s blended yield.
The distinction matters when you compare an individual bid with earnings across several campaigns or placements. A bid-level CPM is not automatically the amount earned across all impressions, and eCPM does not by itself show revenue after a share has been deducted.
The Same Auction, Calculated Two Ways: Worked Examples and a Head-to-Head Table
An advertiser can check its campaign from the other side.
| Comparison | CPM | eCPM |
|---|---|---|
| Who sets or uses it | Advertiser, seller or campaign report | Publisher or monetisation report |
| Typical question | What price was paid per thousand impressions? | What revenue did impressions yield per thousand? |
| Calculation | Campaign cost ÷ measured impressions × 1,000 | Total revenue ÷ impressions × 1,000 |
| Inputs | Spend and the report’s impression count | Revenue and the selected impression count |
| Common mismatch | Spend and delivery may cover different periods or definitions | Blending campaigns or placements can change the average |
When both reports use the same spend, impressions and time window, the calculated rates can align. In practice, compare the underlying inputs before judging the headline figure: a campaign-level price and a publisher-wide average may be valid but answer different questions.
Why Your Reported CPM Doesn’t Match Your eCPM: Layers, Floors and Lag
A price visible at one point in the ad stack may not be the revenue recorded at another, which is why ad revenue analytics should look across the full delivery path. Networks, exchanges, wrappers, bid adapters and ad servers each have a different role, so their reports can show bids, selected prices, delivery or revenue at different stages.
| Layer | What it does | What its report may show |
|---|---|---|
| Ad network | Supplies demand and manages campaigns | Campaign price, delivery or billed spend |
| Ad exchange | Runs auctions between buyers and sellers | Bid or winning auction price |
| Wrapper | Coordinates demand sources and auction responses | Bid comparisons or auction outcomes |
| Prebid bid adapter | Connects a demand source to Prebid | That source’s bid response, not total publisher yield |
| Ad server | Applies delivery decisions and records served ads | Served impressions and associated revenue data |
A visible bid is not necessarily the amount ultimately recorded as publisher revenue. Bids can be filtered or lose the auction, and reporting systems may use different impression definitions, revenue shares or time windows when calculating a yield metric.
Floor prices add another point of divergence. A floor above the price buyers will offer can reduce eligible bids and leave impressions unfilled; a high bid on the remaining impressions does not show the value of inventory that received no bid.
Dynamic floor pricing for publishers is one alternative to a single fixed threshold, but its value depends on how floors are set and assessed across inventory. Our Yield Hub supports dynamic floor pricing; evaluate any change against fill and revenue across comparable placements, rather than the bid price alone.
Before treating a discrepancy as an error, check whether the compared reports cover the same period and whether billing has been finalised. Spend reconciliation can lag delivery reporting, so a temporary mismatch may narrow once the relevant records are complete.
Diagnosing an Anomalous Number: A Placement-Level Triage Workflow
When a reported rate looks wrong, start with the smallest useful slice of inventory rather than changing settings across the site. Compare placements, formats and geographies over the same reporting period, then use the pattern to narrow the cause.
- Segment the result. Break revenue and impressions down by ad placement, format and geography. Check whether a small number of slots accounts for most of the change.
- Use a like-for-like period. Compare with the same period last month, while accounting for differences in traffic volume and mix.
- Check fill before changing a floor. If impressions are going unfilled, investigate eligible demand and floor settings. If fill is steady, examine other changes to delivery or inventory quality.
- Verify billing and reporting status. Confirm that spend was charged and that delivery and billing records cover the same dates before treating an unusually high reported CPM as an error.
- Test one change. Record the affected placements, make a single adjustment and compare revenue, fill and relevant engagement or conversion measures over a suitable period.
| Observed pattern | First checks |
|---|---|
| Very high CPM, weak downstream metrics | Check whether the price is billed, then review conversions, engagement and frequency for the same campaign and period. |
| Very low CPM, no conversions | Segment by placement and inspect where impressions cluster; assess whether those slots contribute useful outcomes. |
| eCPM below visible bids | Compare bid responses with delivered impressions and publisher revenue using matching time windows and impression definitions. |
| eCPM drops after a floor change | Check fill and revenue by the affected placement, country or platform to see whether fewer impressions found eligible demand. |
A high CPM is not automatically good for a publisher, just as a low rate does not explain whether your broader publisher monetization strategy is performing efficiently. Judge the result against your own placements, audience, delivery and business goals; there is no universal benchmark that makes a figure acceptable in every context.
Frequently Asked Questions
How do I calculate eCPM?
The result shows the blended revenue yield per thousand impressions across all campaigns or placements included in the report.
Is CPM per 1000 views?
CPM is a price per thousand impressions, not per thousand views or pageviews. An impression is counted when an ad is actually served, which may differ from how many users viewed the page. Always check which impression definition a report uses before comparing figures across platforms.
What is a higher CPM?
A higher CPM means advertisers paid more per thousand impressions for that campaign. For you as a publisher, a high reported CPM is only useful if the impressions behind it were actually delivered and billed. A high bid on a small slice of inventory does not reflect the yield across all your impressions.
Why doesn’t my reported CPM match my eCPM?
CPM and eCPM answer different questions, so they can legitimately differ. CPM shows the price agreed for a specific campaign, while eCPM averages revenue across all your delivered impressions, including lower-priced campaigns. Layers such as networks, exchanges and ad servers, plus billing lag and different impression definitions, can also cause temporary mismatches.
What is better, CPC or CPM?
Neither CPC nor CPM is universally better; the right choice depends on campaign goals. Advertisers buying brand awareness often prefer CPM because they pay for exposure, while performance campaigns may favour CPC to pay only for clicks. As a publisher, what matters more is the blended eCPM your inventory actually yields.
Is Google Ads CPC or CPM?
Google Ads supports both CPC and CPM bidding, and the choice depends on the campaign type and objective. Advertisers select a bidding strategy based on whether they want to pay for clicks, impressions or conversions. For publishers, the buying model matters less than the effective revenue each impression delivers.
How does RPM differ from eCPM?
RPM is your net publisher revenue per thousand impressions after any revenue share has been deducted, while eCPM shows gross revenue yield before that deduction. Think of it as a ladder: CPM is the bid price, eCPM is the blended yield, and RPM is what actually reaches your accounts. Compare figures at the same level of that ladder before treating a gap as an error.