

Most publishers are not lacking data. In fact, they usually have more than enough.
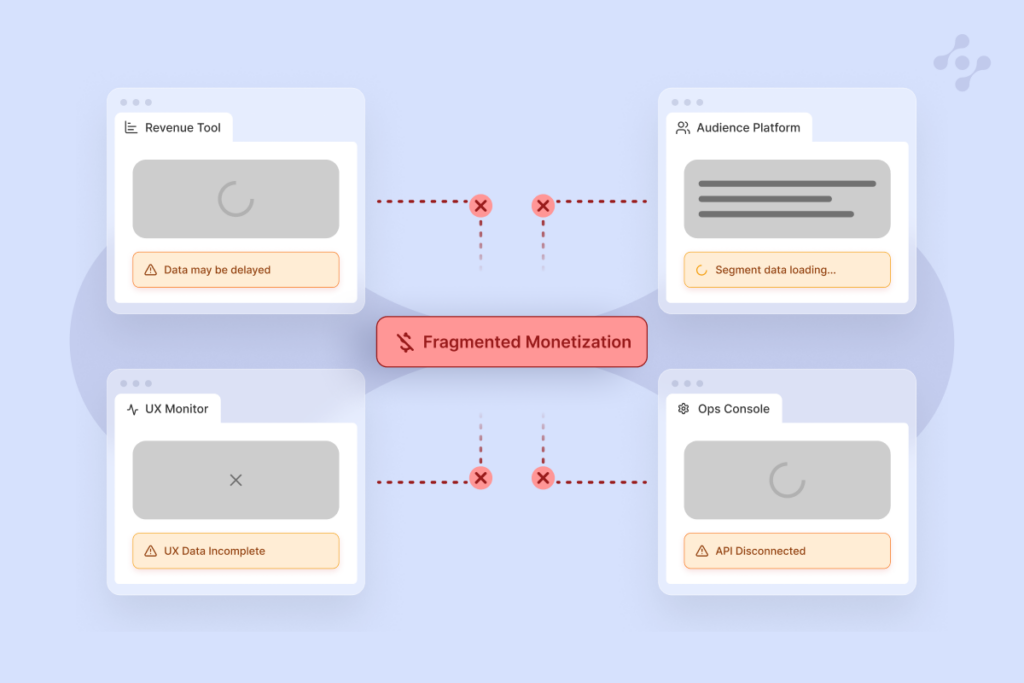
The challenge is that the data is often disconnected.
Across the ad tech stack, the signals needed to understand performance are spread across different tools, dashboards and teams. Audience behaviour, ad revenue, UX, consent, bidder activity and operational alerts may all be monitored somewhere, but rarely in one connected view.
This creates a real challenge for ad stack optimization. When inventory, demand, formats and revenue operations are managed through multiple systems, every decision becomes harder to evaluate.
That makes it harder for publishers to answer the practical questions that matter every day:
- Which pages are under-monetized?
- Which traffic sources generate profitable sessions?
- Which ad slots create the strongest yield?
- Which formats improve revenue without weakening UX?
- Which demand partners are truly contributing to auction competition?
To answer these questions, publishers need more than isolated metrics. They need connected revenue intelligence that helps teams understand how inventory performance is shaped across revenue, audience, UX and operational data.
This is the role Insights Hub is designed to support: helping publishers connect fragmented signals so they can gather actionable insights and make monetization decisions with more context, speed and confidence.
Why Ad Inventory Management Needs to Evolve
Ad inventory management can no longer be reduced to tracking fill rates and average eCPMs.
These metrics still matter, but they do not tell the full story.
A page may generate a high RPM, but that performance may be linked to high ad density that affects the user experience. A traffic source may deliver volume, but its users may scroll less, trigger fewer ad requests or leave before higher-value placements load. A format may create a short-term revenue boost, but slow down the page or reduce engagement over time.
This is why publishers need to evaluate revenue together with the operational and experience signals behind it. When these signals live in separate dashboards, they are difficult to interpret and even harder to act on.
A fragmented ad tech stack also creates gaps between teams. Editorial teams may understand audience engagement. Revenue teams may focus on RPM. Product teams may monitor UX. Publisher revenue leaders may follow bidder and inventory performance.
But ad inventory performance is shaped by all of these signals together.
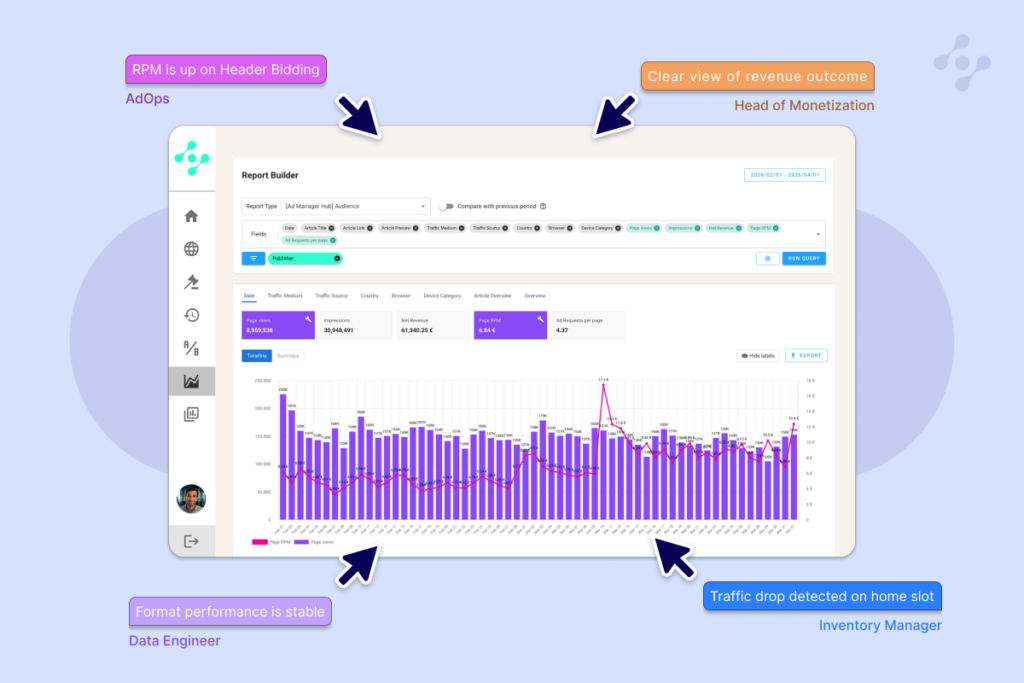
That is why publishers increasingly need an analytics layer that connects performance across the full ad tech stack, helping teams understand content profitability, traffic source value, ad slot performance, demand contribution, bidder behaviour, UX signals and operational changes in one place.
Insights Hub brings these signals into a more connected environment, so publishers can understand not only what is happening across their inventory, but also why it may be happening.
What A Strong Revenue Analytics Solution Should Provide
Managing inventory effectively is difficult when teams only have access to isolated dashboards or retrospective reports.
Publishers need to understand not only what changed, but why it changed and gather actionable insights from it.
Every adjustment can influence multiple outcomes at once (revenue, Page RPM, ad density, latency, viewability, engagement and user experience) when inventory, demand, formats and operational settings are managed through a publisher monetization platform.
A strong revenue analytics solution should help publishers connect those signals instead of forcing teams to interpret them separately.
It should support more flexible analysis, help teams understand the relationship between audience and revenue, bring UX and performance into monetization decisions, and give teams clearer visibility into operational changes.
For publishers, the value is having the right context to understand how revenue performance is shaped across the full ad tech stack.
Insights Hub acts as this connected ad revenue analytics platform, helping publishers move from fragmented reporting to clearer, faster and more actionable monetization decisions.
1. Analytics Flexibility
Ad inventory management is not static. A question that seems simple at first often needs more context.
Fixed dashboards are useful for monitoring recurring KPIs, but they can quickly become limiting when performance questions become more specific.
- How does revenue change by traffic source?
- How does engagement affect monetization?
- How do revenue and UX signals behave together?
- Which authors, devices or page types create the strongest Page RPM?
These are difficult to answer when teams are limited to predefined dashboards.
A revenue leader may need to compare authors by pageviews, revenue and Page RPM. An AdOps team may need to investigate a specific ad slot. A product team may need to understand whether a page template is creating enough value to justify its UX impact.
That level of analysis requires a reporting environment that can adapt to the question.
Flexible reporting allows publishers to build custom reports, create visualizations, run cross-analysis, and access historical data in a way that reflects how their business actually works. This helps teams move beyond simply tracking metrics and investigate performance at the level of detail their inventory requires.
In Insights Hub, custom reporting helps publishers explore the specific relationships behind monetization performance without jumping between tools or rebuilding reports from scratch.

2. Audience and Revenue Intelligence
Increased audience volume does not always translate into more revenue.
Many publishers can identify which articles attract the most readers, but it is often harder to see which articles, authors, audiences or traffic sources generate the strongest revenue outcomes.
That difference is important when making business decisions.
A high-traffic article does not always create high-value sessions. Users may leave quickly, scroll less, reject consent or generate fewer ad opportunities. At the same time, a lower-volume article may create more revenue per session if users stay longer, engage more deeply and trigger higher-value placements.
For ad inventory management, this is a strategic shift.
By connecting signals such as top-performing articles and authors, Page RPM, article profitability, traffic source quality, consent analysis, scroll depth and session-level monetization, publishers can look beyond pageviews and understand how audience behaviour translates into revenue.
This makes it easier to identify which content creates actual value, which themes deserve more editorial investment and which sources bring users who actually engage, scroll and monetize more effectively.
The goal is not only to grow traffic, but to understand which audiences, sessions and content strategies create sustainable monetization value.
Insights Hub bring audience and revenue intelligence together, making it easy for publishers to see which content, users and traffic sources are truly contributing to monetization performance.

3. UX and Performance Intelligence
Revenue signals can be misleading when they are viewed alone.
A page template may generate strong revenue, but also show higher latency. A format may increase impressions, but reduce scroll depth. Another section may have lower ad density, but stronger engagement and better long-term monetization outcomes.
Better ad inventory management means understanding which inventory creates value, in which context, and at what cost to the user experience.
That is why UX and performance intelligence need to sit closer to monetization data.
Publishers need to monitor Core Web Vitals, ad density, latency, speed diagnostics, engagement metrics and web performance indicators alongside revenue performance.
This makes it easier to evaluate formats and placements through both a revenue and quality lens: revenue contribution, viewability, latency, ad density, engagement and overall page experience.
The objective is to understand how revenue and UX influence each other, so growth does not come at the expense of session quality.
By connecting UX and performance intelligence with monetization data, Insights Hub helps publishers understand whether a specific format, placement, page type or traffic source is creating enough value to justify its impact on the user experience.
4. Real-time Operational Visibility
The more complex the ad tech stack becomes, the harder it is to understand what is happening in real time.
More partners, placements, formats and operational dependencies create more potential points of friction. A small issue can stay hidden until it becomes a larger revenue loss. A bidder may stop contributing effectively. A specific ad slot may underperform. A demand type may shift. A configuration change may affect revenue, latency or auction pressure.
Waiting for reporting cycles is not enough when performance is changing continuously.
Publisher revenue leaders need to move faster from detection to diagnosis. They also need a clearer view of how operational performance connects to revenue outcomes.
This changes the rhythm of ad inventory management. Instead of waiting to understand what happened after the fact, publishers need to act while performance is still moving.
Real-time operational visibility allows teams to analyze how each ad slot performs, compare revenue by demand type, understand the balance between direct and programmatic revenue, and assess whether each bidder is truly contributing to auction competitiveness.
For publishers, this means less time spent piecing together what happened and more time deciding what to do next.
With real-time operational visibility, Insights Hub helps publisher revenue leaders detect issues earlier, diagnose performance changes faster and understand how operational decisions connect to revenue outcomes.
Conclusion
Ad inventory management is becoming more complex because publisher revenue is shaped by more than inventory volume alone.
Revenue performance depends on audience behaviour, content context, traffic quality, ad slot strategy, bidder contribution, UX, latency, consent and operational execution.
When these signals are disconnected, teams may have data, but not enough clarity to act with confidence.
Publisher revenue leaders increasingly need to understand which audiences create actual value, which content deserves investment, which formats support revenue without weakening the reader experience, which traffic sources are worth scaling and which parts of the ad tech stack need attention.
They will also need clearer visibility into the impact of the decisions they make, from bidder configuration and pricing rules to traffic acquisition, ad slot strategy and UX optimization.
A connected revenue analytics layer makes this possible by turning fragmented data into clearer intelligence, so teams can make better monetization decisions with more control, speed and confidence.
Insights Hub was built to support this need: helping publishers connect monetization, audience, UX and operational data in one place, so revenue decisions can be made with a fuller understanding of what is driving performance.
To learn how Insights Hub can support your monetization strategy, contact us.
FAQs
A publisher monetization platform helps digital publishers manage and optimize advertising revenue across their websites or apps. It connects key monetization functions such as ad inventory management, demand partners, and header bidding, helping publishers improve revenue while protecting user experience.
Revenue analytics helps publishers understand which pages, audiences, ad slots, formats and traffic sources create the most value. A connected analytics layer makes it easier to diagnose performance changes, detect operational issues and identify where monetization can be improved.