
Ad revenue analytics helps publishers interpret key revenue signals and uncover optimization opportunities by turning auction, delivery, and user-level data into actionable insights that can optimize the ad stack and drive higher revenue.
Introduction
Every impression generates signals. You can see which bidders participated, who won the auction, how much they paid, and whether the ad rendered correctly. You can also see how users interacted with it.
Ad revenue analytics connects signals across placements, audiences, and demand sources. This helps you understand what drives revenue, spot opportunities, and improve performance.
This includes understanding key relationships like eCPM vs CPM, which show how efficiently demand turns into revenue.
One of the best approaches you can take is combining audience and revenue data. When you connect traffic sources, content performance, and monetization outcomes, patterns become much easier to identify.
You can see how different audiences monetize, which articles consistently attract higher-value users, and how engagement influences revenue. Changes in performance often come from shifts in audience composition, not just pricing or demand.
With a strong ad revenue analytics setup, you can clearly identify what drives performance and take action with confidence.

Ad Revenue Analytics Publishers Should Track
Ad revenue analytics relies on a focused set of KPIs that directly explain revenue performance. Each metric provides a specific lens into how your monetization setup behaves.
eCPM (Effective Cost Per Mille)
eCPM represents the revenue actually generated per 1,000 impressions. It is useful because it helps separate traffic problems from monetization problems.
If both impressions and revenue fall at the same rate, the issue is largely one of audience volume. But if revenue declines faster, it suggests each impression is worth less, pointing to issues like weaker demand or underperforming placements.
This makes eCPM one of the most important metrics for identifying whether traffic, efficiency, or both are limiting performance.
Do not interpret eCPM in isolation. A high eCPM can look positive, but low impression volume can limit its business impact. Some premium formats generate strong eCPMs, but their total revenue contribution can remain modest if they deliver few impressions.
In practice, this is why publishers need to look at eCPM together with impression share and total revenue contribution, not just as a standalone signal of success.
It is also important to validate unusually high eCPM values before treating them as a performance win. In some cases, they are the result of reporting issues, misconfigured line items, or broken revenue attribution. Investigate eCPM when it rises far above normal auction behavior, rather than assuming it reflects genuine uplift.
Another key point is that strong viewability does not automatically guarantee strong eCPM. Inventory can be highly viewable and technically healthy, while eCPM still declines because market demand has softened or buyers are bidding less aggressively.
This is why eCPM is such a useful reality check. It shows whether publishers are turning inventory visibility into actual revenue.
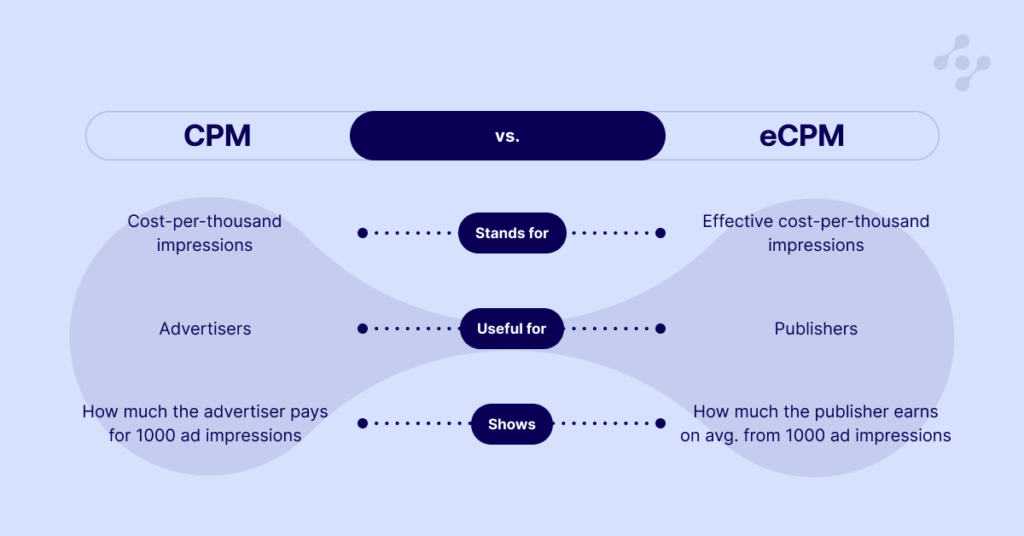
eCpm vs CPM
CPM shows the price advertisers are willing to pay in the auction. It reflects buyer intent and auction pressure. eCPM shows the value publishers ultimately realize after delivery, competition, and monetization conditions.
In a well-optimized setup, these metrics tend to move in tandem. When demand is strong and publishers monetize inventory efficiently, higher CPMs usually lead to higher eCPMs.
When that relationship breaks down, it often signals that available demand is not being fully converted into revenue. This divergence is one of the clearest ways to identify friction in the monetization setup.
When analyzed consistently, eCPM vs CPM becomes one of the most reliable ways to understand where revenue is being left on the table and where optimizations will have the greatest impact.
RPM (Revenue per Mille/Thousand Impressions)
RPM measures total revenue per 1,000 pageviews, providing a broad view of how effectively a page generates monetization.
This metric becomes much more valuable when segmented, since sitewide averages often hide large differences across placements, page types, and traffic conditions. In practice, a small number of high-quality placements can drive most of your RPM, while lower-visibility units quietly pull the average down.
Advanced publishers also prioritize session RPM alongside page RPM to protect long-term growth. While page RPM reflects immediate revenue per pageview, session RPM captures the total value generated across a user’s entire visit.
This is important because high page RPM can act as a false positive if aggressive ad density increases short-term revenue but reduces engagement and drives users to leave earlier.
Consent and monetization conditions also shape RPM more than expected. Consented, actively monetized traffic can show much stronger RPM than the sitewide average, especially when the broader calculation includes non-consented or weakly monetized inventory.
That makes RPM useful not only for measuring page performance, but also for understanding how monetization quality changes across different traffic segments.
Refresh strategy matters as well. RPM is not driven only by demand and placement count, but also by how often impressions are refreshed and how long users actually view them.
Premium placements with strong visibility often benefit from a different refresh setup than lower-visibility inventory. When RPM is analyzed alongside viewability and time-in-view, it becomes easier to see whether increasing impression volume is actually driving more value or just generating impressions that don’t earn much.
In many cases, improving RPM isn’t about adding more ads, but about focusing on the inventory that delivers the most value. This helps you reach a cleaner setup, stronger revenue density, and better long-term outcomes for both you and users.
Fill Rate
Fill rate shows how consistently your inventory converts ad requests into served impressions.
Monitoring fill rate and breaking it down by placement, device, and geography helps you identify where demand is limited and where specific opportunities exist.
Bid Density
Bid density measures how many demand partners actively participate in an auction and how consistently they bid across impressions.
In a healthy setup, major demand partners tend to bid within a relatively stable range, often around 20–40% participation. When some partners fall significantly below that level, dropping closer to 5–15%, it creates an immediate imbalance in the auction. Even if demand exists, it is not being fully expressed across all partners.
This is why you should analyze bid density at the partner level. Some demand sources consistently contribute meaningful competition, while others participate selectively or underperform on the same inventory. Identifying these gaps is critical to understanding whether performance issues come from weak demand, poor traffic alignment, or technical inefficiencies in the setup.
Higher bid density strengthens auction pressure and leads to more competitive pricing. But strong performance does not come from simply adding more partners. Consistent and meaningful participation is what matters most.
Another important signal is the relationship between spend and participation. Rising spend with low bid density often indicates that revenue is concentrated among a limited set of partners, rather than distributed across a competitive auction. This reduces pricing tension and limits overall efficiency.
Having a clean view of your auctions’ bid density makes it easier to diagnose issues and ensure that demand is both diverse and effectively competing.

Viewability
Higher viewability increases the value of your inventory as it reflects how effectively your placements capture attention and convert demand into revenue.
But viewability is not uniform across a page. It naturally improves with user engagement, meaning placements further down the page often outperform those above the fold. Even when placements are technically optimized (lazy loading, refresh, positioning), they can still underperform if users do not reach them or do not stay in view long enough. Treating all placements equally in that context leads to inefficient monetization.
Viewability is also shaped by how ads are delivered, not just where they are placed. Lazy loading ensures impressions are only triggered when users are likely to see them, while refresh logic and scroll behavior determine how long placements remain active and visible. This makes user engagement and content structure critical drivers of performance, as shorter sessions or shallow scroll depth directly limit viewability potential.
The real opportunity comes from isolating low-viewability slots and making deliberate decisions. In some cases, reducing pressure on these placements improves overall auction efficiency. In others, adapting the format (such as using sticky or anchored placements) can increase time-in-view and unlock additional value where standard display struggles.
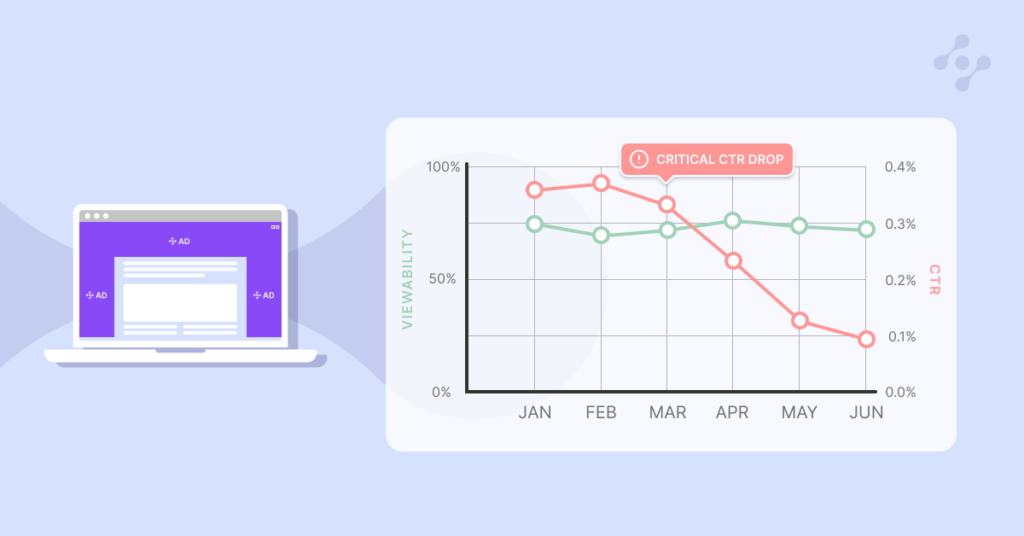
This makes viewability a core optimization signal, not just a reporting metric. When analyzed alongside CTR, engagement, and ad request behavior, it helps prioritize high-impact inventory, avoid wasted bid pressure, and maintain a balance between monetization, user experience, and long-term demand quality.
CTR (Click-Through Rate)
CTR works best when analyzed alongside metrics such as viewability and eCPM to build a more complete understanding of your performance, as CTR can vary significantly depending on placement, format, and demand type.
Even within the same position, performance can differ substantially. In some cases, the same placement can generate a CTR of 0.46 under programmatic demand and 0.05 under direct campaigns, showing that CTR is not driven by placement alone.
Placements that generate high impression volume but low CTR, especially when users scroll past them quickly or do not meaningfully engage, typically indicate low engagement and limited effectiveness.
For this reason, CTR should be interpreted carefully. Differences in performance often reflect how inventory is distributed across placements, how formats are implemented, and how campaigns are configured.
Conclusion
Ad revenue analytics gives you direct visibility into how your monetization setup performs and where it can be improved.
By combining KPIs such as eCPM, RPM, fill rate, and bid density, you can build a precise view of auction performance and locate optimization opportunities.
The most valuable insights come from connecting audience behavior, content performance, and auction dynamics. When these elements are analyzed together, they reveal patterns that lead to smarter, more impactful decisions.
Publishers who invest in yield analytics gain greater control over their monetization strategy and drive more consistent, scalable revenue growth.

FAQs
Ad revenue analytics refers to the process of collecting and analyzing data related to ad performance, including metrics such as eCPM, fill rate, and bid density, to understand how inventory generates revenue and where optimizations can be made.
Publishers can improve their analytics by consolidating data from their ad tech stack, focusing on key performance metrics, and monitoring changes as they happen.
Working with strategic partners such as Opti Digital can help uncover insights that are not immediately visible in standard reporting.
Ad stacking is a form of ad fraud where multiple ads are layered on top of each other in a single ad slot. While only the top ad is visible to the user, all ads in the “stack” register an impression.
Identifying ad stacking in your analytics is crucial because it can lead to clawbacks from demand partners and permanent blacklisting by SSPs.
Sophisticated yield analytics help you detect ad stacking by flagging abnormal impression volumes that don’t align with your actual pageview data.