
An effective ad tech stack helps publishers manage advertising operations, gain visibility into demand partners, analyze performance data, and ultimately, maximize revenue.
Introduction
Every impression served on a publisher’s website or app passes through a chain of technology decisions: which ad to show, which buyer won the auction, how much it earned, and whether it was tracked correctly.
Most of that happens in milliseconds, invisibly, and the quality of the systems behind it has a direct bearing on how much revenue a publisher actually generates.
The collection of those systems is what is known as an ad tech stack. It is a set of interconnected tools that need to work well together, be monitored continuously, and be adjusted as the advertising landscape shifts constantly.
A well-structured ad tech stack does three things:
- Connects inventory to the widest relevant pool of advertiser demand.
- Measures what is happening across every ad unit, demand source, and audience segment.
- Gives publishers the visibility to act on that data rather.
That last point is where many publishers underinvest.
This article covers the core components of an effective ad tech stack, how real-time and yield analytics fit into it, and what publishers should be paying attention to if they want to get more out of the inventory they already have.

Core Components of an Ad Tech Stack
No two publishers have identical setups, since factors such as traffic volume and team size often determine which tools make sense to invest in. But underneath that variation, most effective ad tech stacks are built around the same core components.
Ad Server
The ad server is the operational center of the stack.
It manages how ads are delivered across every page and placement, tracks impressions and clicks, and determines which demand source wins each auction.
It is also the primary source of reporting data that feeds into analytics, making it the foundation everything else is built on.
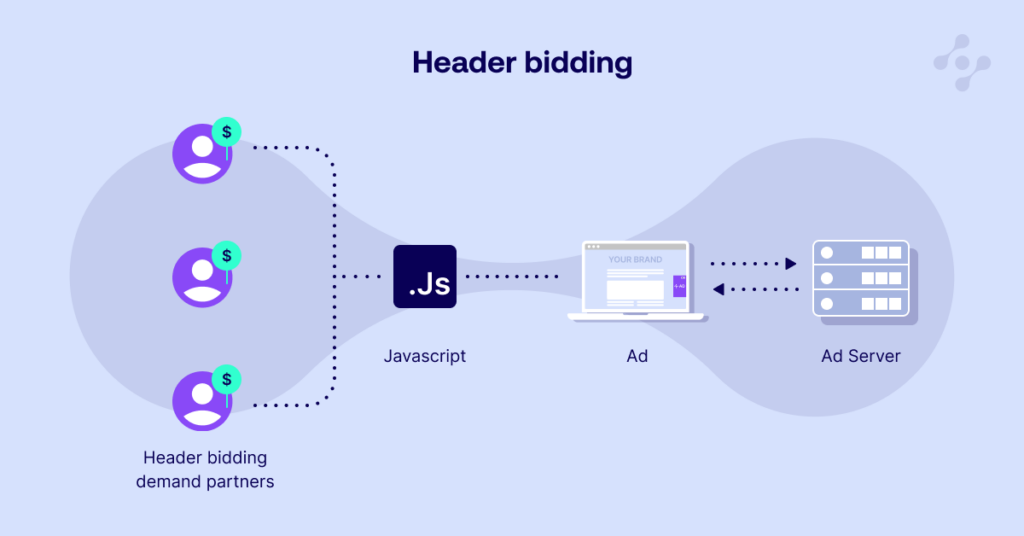
Header Bidding Wrapper
Header bidding allows multiple demand partners to compete simultaneously for an impression, which tends to push prices up by creating genuine auction competition. For context, a Statista study revealed that 2.3% of the top one million websites worldwide used header-bidding technology in October 2024, showing its growing usage by top publishers.
In theory, more partners means more competition and higher revenue. In practice, it is more nuanced than that.
When too many partners connect directly through the header bidding wrapper, page load times increase and the slowest bidder can effectively slow down the entire auction.
Publishers are increasingly selective as a result, prioritizing partners that consistently contribute meaningful demand rather than simply adding to the count.
Server-side bidding has gained traction as a way to run auctions off the page and reduce latency. But it is not a straightforward replacement for client-side bidding.
The most effective approach tends to be a hybrid: client-side for placements where latency is manageable and demand is strong, server-side where speed is the priority or user behavior on the page demands it.
The right mix depends on your specific inventory, and it is worth evaluating each ad unit individually rather than applying a one-stop approach.
Supply-Side Platforms (SSPs)
SSPs are how publishers connect their inventory to advertiser demand at scale. Through these platforms, impressions become available to a broad pool of buyers competing in real time.
Choosing which SSPs to work with, and how to configure them, is an important decision publishers must make.
Analytics and Reporting Tools
Analytics tools are what turn the raw output of your ad server and SSPs into something you can actually act on. They consolidate data from across the stack and demonstrate it in ways that make patterns visible and decisions easier to make.
The strongest solutions let publishers slice performance across three dimensions that interact with each other in important ways.
Inventory-level analytics break down performance by placement, campaign type, and demand source. Knowing how open auction revenue compares to direct deals, or which positions on a page consistently outperform others, gives publishers the information they need to make smarter decisions about how inventory is structured and priced.
Audience-level analytics reveal which traffic sources generate the most advertising value. Search traffic, for example, often monetizes significantly better than social traffic, not just because of intent signals but because of how it intersects with geography, consent rates, and advertiser targeting. Understanding that dynamic can directly inform SEO and content acquisition strategy.
Content-level reporting shows which articles, formats, and authors drive the strongest engagement and revenue. Editorial teams that have access to this data can make layout and format decisions with revenue implications in mind, not just audience ones.
Together, these layers give you a much clearer picture of how audience behavior, content performance, and inventory structure combine to drive revenue.

Leveraging Real-Time Analytics
Real-time analytics run quietly in the background, but when a problem occurs, their importance becomes immediately evident.
Some indicators worth watching closely are:
- Bid Response Latency: How long are demand partners taking to respond? A slow bidder doesn’t just lose that auction; depending on your wrapper configuration, they can hold up the entire process.
- Fill Rate by Placement and Device: A sudden drop in fill rarely affects everything at once. It tends to be specific: one ad unit, one device type, one geo. Real-time fill monitoring helps you pinpoint where the problem actually is.
- Auction Participation: Which SSPs are actively bidding, and which have gone silent? A partner that’s present in your wrapper but not submitting bids is contributing latency without contributing revenue.
- Ad Refresh Behavior: The frequency at which ads are refreshed on a page should be monitored carefully. While more frequent refreshes can increase impression counts, they often reduce the metrics advertisers care about most, including engagement rates, viewability, and click-through performance. Over time, overly aggressive refresh strategies can erode the perceived quality of inventory and lower what demand partners are willing to pay, meaning short-term impression gains may come at the cost of long-term auction value.
Integrating Yield Analytics
An ad stack can be technically healthy, with strong fill rates, low latency, and stable auction participation, and still be underperforming. Yield analytics is what surfaces that gap. It looks at historical patterns across your inventory to evaluate whether each segment is generating what it realistically should be.
Metrics to monitor include:
- eCPM: Revenue per 1,000 impressions. The most common benchmark for comparing inventory value across placements, partners, and time periods.
- Fill Rate: The share of ad requests that result in a served ad. A consistently low fill rate on a specific placement often points to a targeting, floor price, or demand routing issue worth investigating.
- RPM (Revenue per Mille): Total revenue per 1,000 pageviews, not just per impression. RPM accounts for the full value of a page, making it a more honest measure of how your overall monetization is performing.
- Bid Density: The average number of bids received per impression. A high bid density indicates that multiple demand partners are actively competing for your inventory, which strengthens auction competition. A low bid density suggests that revenue depends on a small number of buyers, making monetization more fragile if a major demand partner reduces spend or exits a category.
Where yield analytics get interesting is when you start cutting the data by audience segment rather than just by placement or partner.
Publishers often assume that revenue fluctuations are driven by eCPM shifts or fill rate changes, and sometimes they are. But a surprising amount of revenue variance comes from changes in audience composition: which articles are driving traffic that day, where visitors are coming from, and how those audiences behave differently with ads.
Two publishers with identical pageview counts and similar eCPMs can generate very different revenue if one’s traffic is more geographically concentrated in premium markets. This is why the most useful yield analysis combines traffic attributes, content type, consent signals, and revenue data together rather than looking at each in isolation.
When you can see that a particular content category consistently attracts high-value audiences, or that a specific traffic source monetizes significantly above average, you have something actionable. You can feed that insight back into editorial strategy, traffic acquisition, or how you prioritize ad product development.
Yield analytics, done well, is one of the clearest paths publishers have to growing revenue even with smaller traffic.

Monitoring User Experience and Consent Signals
Revenue and user experience are more connected than they might seem.
A page that loads slowly, shifts around as ads inject, or bombards visitors with too many placements will eventually show it in the numbers, through higher bounce rates, lower engagement, and demand partners that start to discount your inventory.
This is why smart publishers track Core Web Vitals alongside their advertising data. Metrics like Largest Contentful Paint (LCP) and Cumulative Layout Shift (CLS) give you a read on how your ad setup is affecting the actual page experience. During A/B tests of new ad layouts or monetization strategies, these signals are especially valuable: they tell you whether a revenue gain is coming at the cost of something you can’t easily see in your ad reporting alone.
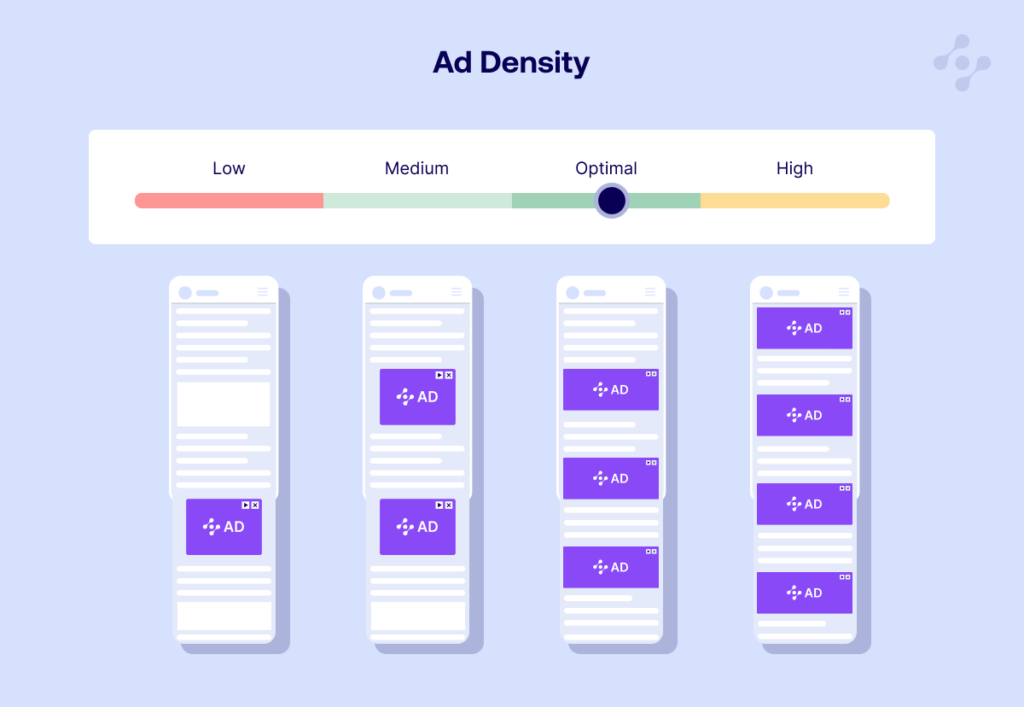
Ad density is another number worth keeping an eye on. It measures how much of a page is taken up by advertising versus editorial content. Google’s guidance puts the threshold at roughly 30% of visible page content, and staying within that range matters both for user experience and for avoiding penalties tied to intrusive ad experiences. The practical reality is that pages stuffed with ads tend to perform worse over time, not better.
Consent management deserves equal attention, and it’s often underestimated as a revenue lever. Most publishers think of their consent framework primarily as a legal requirement, which it is, but the data it generates is also genuinely useful. Tracking consent acceptance rates, bounce rates on consent prompts, and timeout events that block ad requests from firing gives you a clear picture of where revenue is quietly leaking out.
The connection to monetization is direct. When more users accept consent, publishers unlock more addressable inventory and richer audience signals. That means more demand partners can participate fully in auctions, and the ones that rely on consent data to bid competitively will pay more for it. Improving your consent flow is not just a compliance exercise; it is one of the more underrated optimization opportunities available to publishers right now.
Conclusion
A well-designed ad tech stack enables publishers to manage advertising operations efficiently while maintaining transparency across their monetization systems.
Real-time monitoring helps detect operational issues quickly, while yield analytics reveals long-term performance trends. Together, these insights support smarter decisions about demand partners, placements, and inventory strategies.
Publishers who build that feedback loop into how they operate will be better positioned to grow revenue without compromising the user experience that makes their audience worth monetizing in the first place.
FAQs
Publishers can improve their stack by integrating reliable demand partners, implementing strong ad revenue analytics, monitoring performance regularly, and optimizing inventory layouts based on data-driven insights. Many publishers also work with strategic partners, such as Opti Digital, that help manage infrastructure, analyze performance data, and identify revenue optimization opportunities.
An ad tech stack is the collection of technologies publishers use to manage digital advertising.
Ad revenue analytics helps publishers understand how their inventory generates income. By analyzing metrics such as eCPM, fill rate, and RPM, publishers can identify trends, and evaluate placements.